Optimizing Lottery Data Forecasting with LSTM Networks
To address the current LSTM issues with lottery history numbers, we at gameseer.net tried new data preparation approaches to improve the efficiency and accuracy of LSTM predictions.


Introduction
Recurrent Neural Networks (RNNs) are a class of artificial neural networks designed for sequential data. Unlike traditional feed-forward neural networks, RNNs have connections that form directed cycles, enabling them to maintain a form of memory of previous inputs. This makes them particularly well-suited for tasks where the order of data is crucial, such as language modeling, speech recognition, and time series prediction.
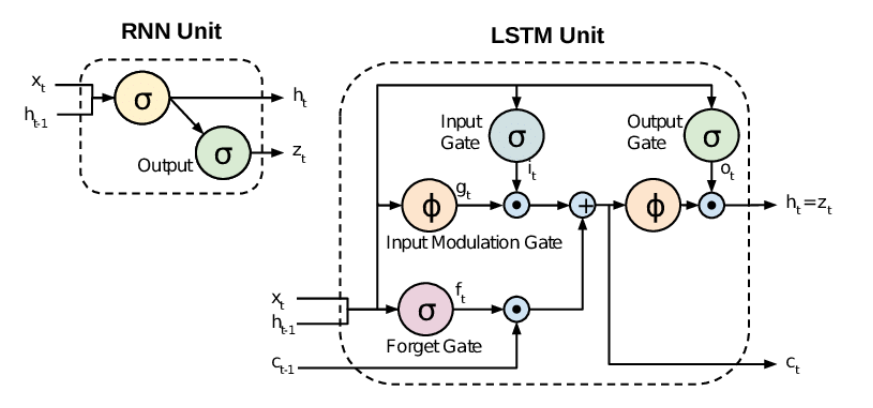
Long Short-Term Memory (LSTM) networks are a special kind of RNN, capable of learning long-term dependencies. They were introduced to address the vanishing gradient problem that standard RNNs suffer from, which makes it difficult to learn and retain long-term information. LSTM networks utilize memory cells that can maintain information in memory for extended periods. These cells contain gates that regulate the flow of information, allowing the network to decide which information to keep and which to discard.
LSTM networks have been highly successful in various time series data applications due to their ability to remember long sequences of data. In the financial industry, they are used for stock price prediction, algorithmic trading, and risk management. In healthcare, LSTMs analyze patient data for disease prediction and treatment recommendations. In predictive maintenance, LSTMs analyze equipment sensor data to forecast potential failures, enabling proactive maintenance and reducing downtime, while in transportation, they are used for traffic flow prediction and route optimization.
In the service industry, LSTM networks have significantly improved customer experience and operational efficiency. Customer service centers use LSTMs to predict customer inquiries and optimize response strategies. Retailers employ LSTMs for demand forecasting and inventory management. Moreover, in marketing, LSTMs help in understanding customer behavior and personalizing recommendations, leading to better customer retention and satisfaction.
Despite their widespread success, LSTM networks have notable shortcomings in certain areas, particularly in some time series random number analytics, such as lottery prediction. The main limitation lies in the nature of the data itself. Lottery numbers are inherently random, and the patterns that LSTMs excel at identifying are not present in truly random sequences. This makes it exceedingly difficult for LSTMs to provide meaningful predictions in this context.
Additionally, LSTMs require a substantial amount of data to train effectively. In scenarios involving random numbers, the data does not follow predictable patterns, leading to overfitting and poor generalization on new data. The stochastic nature of lottery draws defies the core strength of LSTMs, which is to capture temporal dependencies and trends. As a result, while LSTMs can model complex dependencies in sequential data, their performance in predicting random numbers remains fundamentally constrained by the unpredictability and lack of patterns in the data.
Despite these challenges, LSTM remains a popular tool for intelligent analytics in time series random number and lottery data. Many researchers and practitioners continue to experiment with LSTM networks to uncover potential predictive power in these datasets. At the end of this post, there are references to several articles and projects that document these attempts and tests.
To address the current LSTM issues with lottery history numbers, we at GameSeer tried new data preparation approaches to improve the efficiency and accuracy of LSTM predictions.
LSTM Example Codes
LSTM implementations are widely used in many Python projects. You can also find numerous Jupyter notebooks for testing and evaluating LSTM on time series random data.
The following is part of an example of such implementations.
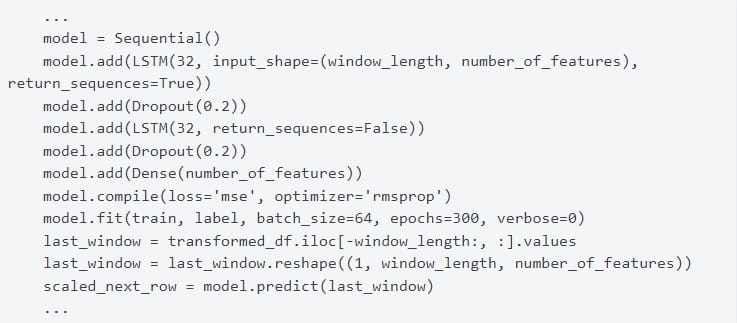
LSTM is a machine learning model that requires a defined working profile containing many factors to perform training (model.fit) and prediction (model.predict). If you are interested in understanding the function and algorithm selections for the model, you can study a series of articles posted by Dr. Jason Brownlee on machinelearningmastery.com.
Data Preparation into Binary Form
Based on existing experiments, we aim to optimize our solution by altering the dataset preparation method. The main idea is to transform the lottery decimal numbers into different domains and numerical systems, revealing more statistical and sequential patterns that can be recognized and processed by AI models, deep neural networks, and algorithms.
Currently, we map decimal ball values to binary data, creating a 2D binary map with 49, 69, or 70 columns/features, depending on the lottery type. By applying LSTM to the binary form of the original decimal data, we observe different forecasting results.
We take the recent Canada BC49 lottery history numbers as an example. The following shows the lossless binary mapping data from the original data set.
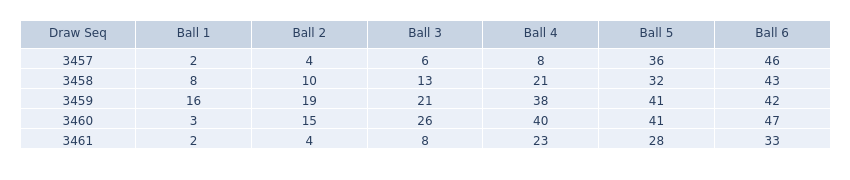
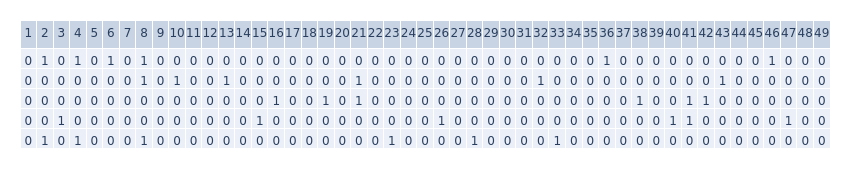
Drawing from the history of signal processing, we know that digitization for audio signals shows PCM signals are more robust and tolerant for transmission and storage than analogue signal. In the real world, it's harder to deteriorate from 1 to 0 than from 49 to 48.
For lottery data analytics, we can also "digitize" the lottery data by mapping the six decimal numbers representing the balls to 49 binary digits. Instead of forecasting based on the original six decimal numbers, a machine can predict 49 binary values (either ‘1’ or ‘0’). This approach introduces an additional option beyond the conventional method of directly forecasting using the original decimal numbers.
Lottery Numbers in Bitmap Form
Lottery history data as two-dimensional binary data forms a bitmap. Binary bitmap dataset allows the use of advanced algorithms and machine learning methods developed from 2D image processing fields. For graph service, we provide a 2D bitmap graph for each lottery type, allowing customers to evaluate the visual pattern appearance and distributions.
Viewing the bitmap form data, you can see it resembles a net with knots and black holes. Extending the time axis longer makes it more apparent that the knots and holes are evenly distributed. Even to the human eye, you can sense some number areas are currently in knot zones or hole zones, helping to predict future patterns. We believe future algorithms, deep neural networks, and machine learning models can detect visual patterns better than human eyes.
For more background about data mapping and reflection, refer to our post "Lottery Data From Different Angles".
LSTM Forecasting Methods and Graphs
We provide three types of LSTM forecasting graphs for each lottery type, corresponding to three LSTM forecasting methods:
- 2D-Multiple-Balls-Together
- 2D-Individual-Ball-Ranking
- 1D-Individual-Number
For each type, we provide two graphs: one for the current prediction for the next draw and another for the historical result graph, which plots the past three draws' predictions compared with the actual drawn numbers.
In these history graphs, the past three draws' predictions were recorded and compared with revealed six drawn numbers, the drawn numbers' bar pole is painted orange. It's intuitive for you to evaluate the LSTM model's prediction accuracy.
LSTM Method1: "2D-Multiple-Balls-Together"
The following two graphs are for the "2D-Multiple-Balls-Together" method. In the history graph, you can select "Last Draw," "Second-to-last," or "Third-to-last" for one of the past three draws.
For all three methods, we map the six ball decimal numbers to 49 binary numbers first. The following LSTM data process is on the binary bitmap form. The two "2D" methods set LSTM features to 49, treating the bitmap as a whole (in contrast to the "1D" method below).
The LSTM parameters are set as follows: number_of_features = 49, window_length = 15, epochs = 300, loss = 'mse', optimizer = 'rmsprop'.
Multiple Fit/Predict Loop
Our second unique process, differing from the ordinary LSTM prediction method, is using multiple model.fit/model.predict loops instead of large epoch numbers. From our experiences processing TSRN data, increasing the number of epochs may lead to overfitting, where the model becomes too focused on the training (history) data and performs poorly.
Moreover, for LSTM models, fitting and predicting based on similar preset parameters and datasets may yield different results each time. This is similar to other AI models, where you may not expect the same answer each time for the same question. So, we use a model fit/prediction loop for four times for the "2D-Multiple-Balls-Together" method to accumulate four results of LSTM predictions. Typically, the more model fit/prediction loops, the more helpful the accumulated result.
LSTM Method2: "2D-Individual-Ball-Ranking"
The next two graphs are for the "2D-Individual-Ball-Ranking" method.
The "2D-Individual-Ball-Ranking" method differs from the previous method by processing LSTM predictions for one ball at a time. It maps one ball into a 49-number bitmap instead of six balls. After obtaining the LSTM prediction result counter dataset for each of the six balls, two checksum methods are applied. One method accumulates six counter dataset arrays into one "Sum Count" dataset. The other ranks the top five counters for each ball, setting a rank position dataset array. Then, it accumulates the six balls' rank datasets instead of the prediction counter dataset itself. The "2D-Individual-Ball-Ranking" method also uses model fit/prediction loops, applying LSTM forecasting multiple times.
LSTM Method3: "1D-Individual-Number"
The third method, "1D-Individual-Number," processes the binary data not in bitmap form as a whole but as a 1-dimensional bitstream for each of the 49 numbers. The following graphs illustrate this method result:
Unlike the previous two methods, the "1D-Individual-Number" method treats each of the 49 binary numbers as a separate series. This means the number of features for the LSTM is set to 1 instead of 49, similar to processing 49 threads of Morse code. After predicting each of the 49 numbers individually, we accumulate all the loop result counters to generate the final graph.
Conclusion
You can review and compare all three methods using our intuitive history graphs. These graphs make it easy to evaluate the LSTM models and methods. As you can see, the current techniques cannot guarantee a jackpot win. While they may occasionally exceed the 6/49=0.12245 random chance threshold, the lottery remains a game of chance.
You can sign up and log in to view all other lottery data and LSTM forecasting graphs, including Powerball and Mega Millions from the states, as well as Lotto 649 and Lotto Max from Canada.
If you're serious about exploring new approaches to forecasting time series random numbers, please contact us via email or other means. We have insights and methodologies to discuss.
Good luck with the lottery!
References
(sequence by random)
- "Time Series Prediction with LSTM Recurrent Neural Networks in Python with Keras" by Jason Brownlee - https://machinelearningmastery.com/time-series-prediction-lstm-recurrent-neural-networks-python-keras/
- "How to Choose an Activation Function for Deep Learning" by Jason Brownlee - https://machinelearningmastery.com/choose-an-activation-function-for-deep-learning
- "How to Choose an Optimization Algorithm" by Jason Brownlee - https://machinelearningmastery.com/tour-of-optimization-algorithms/
- "How to Guess Accurately 3 Lottery Numbers Out of 6 using LSTM Model" by Roi Polanitzer - https://medium.com/@polanitzer/how-to-guess-accurately-3-lottery-numbers-out-of-6-using-lstm-model-e148d1c632d6
- "How to Guess Accurately 3 Lottery Numbers Out of 6 using LSTM Model" by Roi Polanitzer - https://github.com/TimeSerieser/How-to-Guess-Accurately-3-Lottery-Numbers-Out-of-6-using-LSTM
- "How to Guess Accurately 3 Lottery Numbers Out of 6 using LSTM Model" by
Satanyu - https://medium.com/@satanyu666/how-to-guess-accurately-3-lottery-numbers-out-of-6-using-lstm-model-44ef080d490c - "lottery-prediction-lstm" by rahulmod - https://github.com/rahulmod/lottery-prediction-lstm
- "Israeli Lotto Prediction using LSTM" by EM FHAL - https://www.kaggle.com/code/emfhal/israeli-lotto-prediction-using-lstm/notebook
- "EUROMILLION/Lotto Prediction using LSTM" by EM FHAL - https://www.kaggle.com/code/emfhal/euromillion-lotto-prediction-using-lstm
- "Leveraging AI and Python for Lotto Number Prediction" by Huatin OU - https://vocal.media/01/leveraging-ai-and-python-for-lotto-number-prediction