Lottery Data From Different Angles
We explore lottery winning data from various perspectives. We analyze the history of lottery numbers to uncover patterns and insights.


Introduction
In this post, we explore lottery winning data from various perspectives. We analyze the history of lottery numbers to uncover patterns and insights.
While it's often assumed that lottery numbers are purely random, the reality is that different authorities use various computerized algorithms or machines that may impact randomness. For the sake of this discussion, we'll treat lottery winning numbers as purely random.
We'll use Canada's BC49 lottery as an example. BC49 is a 6/49 jackpot lottery, and our analysis focuses on the six regular drawn numbers, excluding the bonus number. We refer to a regular drawn number as a "ball."
Some graphs in this post are toggleable and interactive, allowing readers to toggle to full screen and select different options for draws and numbers, and to zoom in on specific graph zones.
Lottery Numbers in a 3D Coordinate System
At GameSeer, we visualize lottery winning numbers in a three-dimensional coordinate system. Our pioneering research aims to explore analytics in 3D.
Let's take the recent five draws of BC49 data as an example:
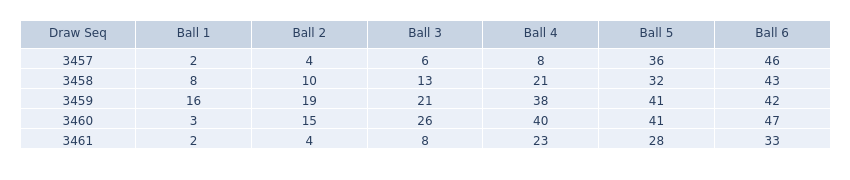
This set of lottery data can be mapped into a 3D coordinate system as follows.
Right click on the graph and move mouse around to view it in different angles:
Each lottery ball has 3 coordinates. Specifically:
- The x-coordinate: Represents the difference of the same order ball in adjacent draws (denoted as Bx).
- The y-coordinate: Represents the difference between adjacent balls in the same draw (denoted as By).
- The z-coordinate: Represents the ball's number itself in the draw (denoted as Bz).
In the above 3D graph, the adjacent ball difference in a draw is denoted for balls 1 to 6 as By1 to By6. Their values are: By1 = 49 - Bz6 + Bz1, By2 = Bz2 - Bz1, By3 = Bz3 - Bz2, By4 = Bz4 - Bz3, By5 = Bz5 - Bz4, By6 = Bz6 - Bz5. By1 is a loop-roundup difference from By6, while other By values are simply the difference from the prior order ball.
Typically, people only consider the ball number itself (Bz data) for lottery analytics. However, all three coordinates exhibit the same mathematical or statistical properties and should be analyzed similarly. Analyzing all three coordinates increases the possibility of improving accuracy.
Multi-layer Coordinate System Mapping
We refer to the above differentiation of views for lottery data as data mapping. This data mapping can have multiple layers. For example, the ball-difference/y-coordinate of a specific draw (x scale = i) are: By6(i), By5(i), By4(i), By3(i), By2(i), By1(i). This set of six values and its adjacent next draw value By6(i+1), By5(i+1), By4(i+1), By3(i+1), By2(i+1), By1(i+1) can form a second layer of draw difference mapping. To simplify, we will only discuss the first layer of such data mapping; the principles apply to other deeper layers.
Lottery Number and Data in GameSeer Graphs
Currently, our interactive graphs process and display one dimension of the lottery data, primarily showing the ball number itself (Bz data) with a total of 14 types of graphs. We can also offer the same for Bx and By, but currently, we only have three graphs for each as examples. In our discussion, we focus on one dimension, mainly ball numbers and their statistical data.
The most common graph for lottery data is the lottery ball number history in a bar style. The following graph is a stacked bar for all balls. You can enable or disable one or more balls.
Lottery Numbers in Binary form
At GameSeer, we also view lottery winning numbers' one-dimensional data in multiple numeral systems, not just decimal.
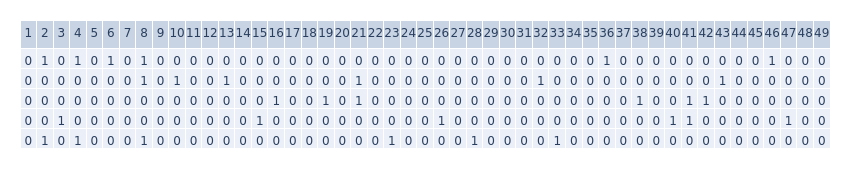
The following shows the lossless binary mapping data from the original data set.
Drawing from the history of signal processing, we know that digitization for audio signals shows PCM signals are more robust and tolerant for transmission and storage than analogue signal. In the real world, it's harder to deteriorate from 1 to 0 than from 49 to 48.
For lottery data analytics, we can also "digitize" lottery data by mapping six ball decimal numbers to 49 binary numbers. To forecast, a machine can try to guess 49 times of "1 or 0" instead of six times of "1 or 2 or ... 48 or 49". This approach introduces an additional option beyond the conventional method of directly forecasting using the original decimal numbers.
Lottery Numbers in Bitmap Form
Lottery history data as two-dimensional binary data forms a bitmap, allowing the use of advanced algorithms and machine learning methods developed from 2D image processing fields.
We provide a 2D bitmap graph for each lottery type, allowing customers to evaluate the visual pattern appearance and distributions.
Viewing the bitmap form data, you can see it resembles a net with knots and black holes. Extending the time axis longer makes it more apparent that the knots and holes are evenly distributed.
Even from the human eye, you can sense some number areas are currently in knot zones or hole zones, helping to predict future patterns. We believe future algorithms, deep neural networks, and machine learning models can detect visual patterns better than human eyes.
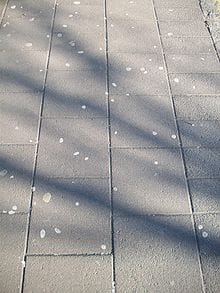
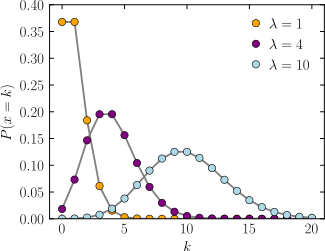
You can also compare the lottery number bitmap with the following picture. Applying Poisson distribution analysis to lottery number distribution could be interesting.
Lottery Data in Other Domains
Time series random data, including lottery history numbers, can be transformed into other domains from its original time domain. The most used domain is the frequency domain. Similar to other popular FFT transformation applications, occurrence frequency processing and statistics are very helpful in lottery data analytics. Therefore, we provide several frequency domain graphs.
The following is an example graph in the frequency domain for a long-term period.
Unlike the number history graph, the occurrence frequency graph's x-axis is ball numbers, ranging from 1 to 49, instead of the time domain draw sequence.
The chance of appearance for each number from 1 to 49 in a draw is 6/49 = 0.12245. In the long run, each number's actual presence will be approximate 0.12245 times the number of draws. The above graph shows results from 3000 draws, and you can see each number fluctuates slightly around 0.12245 x 3000 = 367 times.
You can select more options for 2000 draws, 1000 draws, etc. The shorter the period, the more fluctuation in appearance. You can even compare them with the short-term period as follows.
Since the long-term appearance chance is constrained to 6/49 = 0.12245, you can expect nature to compensate for a number that hasn't shown up recently.
Conversely, if a number has appeared frequently, it may not show up as often in the future. However, nature doesn't rush; just because a number hasn't appeared recently doesn't mean it will appear immediately. Instead, nature balances out over time.
Mid-term statistics (50 to 200 draws) are more useful than long-term statistics as they can identify the current draw's period type, if it's in an occurrence monsoon summer or in dry winter.
If a specific number's occurrence is low in the short term (recent 5 or 10 draws), don't rush to judge it will appear in the next draws; check its mid-term season and tendency as well.
Ideal analytics should evolve beyond the traditional short, mid, and long-term periods, embracing more nuanced timeframes. Within each historical term, distinct weights should be assigned to current predictions—favoring recent data with greater emphasis. Algorithms should explicitly account for this temporal factor in their analytical models.
Lottery Numbers Occurrence History Data
GameSeer provides another category of graphs related to occurrence: lottery number occurrence history data graphs.
Unlike frequency domain occurrence data, lottery number occurrence history data is in the time domain, collecting the number occurrence counts in a series of time windows to form a statistical result over time.
In the following graph, the x-axis represents a 5-draw slot sequence. Every five draws, we count a specific number's occurrence and present it on the y-axis for this time slot.
Another type of graph differs slightly. Its x-axis is the draw sequence, similar to other ordinary history graphs. The y-axis count for each draw is the summary of occurrences traced back 10 draws from this draw. It's a convolutional 10-draw count value based on each draw.
The occurrence history data graph is important and intuitive for understanding the recent tendency of a specific ball number's appearance.
Lottery Statistical Data Distribution Patterns
The statistical distribution patterns for lottery data are the most interesting and important for analytics.
The applied manual rules, such as the upper limit of 49 on the random number of six balls, demonstrate some fascinating patterns.
Our previous experience in the telecommunication transmission field links our thoughts on lottery data patterns to Rayleigh fading over radio channels.
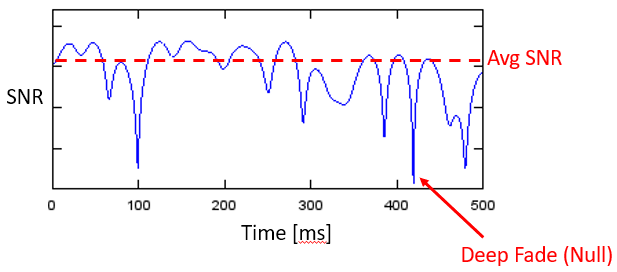
The upper limit of the radio signal over space is the source power. The signal deteriorates and fades during transmission, but not smoothly. Instead, it exhibits a pattern where it mostly tries to stay near the upper limit but occasionally falls into deep fades. The average SNR results from many high points and few deep lows.
This situation is similar to edge ball number distribution for the lottery.
If you transform the above diagram's time domain data into the frequency domain, the shape of the occurrence distribution resembles a Poisson distribution curve, especially for λ = 1.
Now let's see what the lottery number occurrence distribution shows.
This beautiful butterfly shape distribution reveals that, in most cases, the ball-6 appears around 43, and the distribution is not even—cases near 49 are much more frequent than those around 40 and below.
This pattern is similar to fading radio signals over a wireless channel. The occurrence of deep fades is much lower than the tendency to stay close to the upper limit.
You can find a similar pattern on the lower end. Instead of seeing even edge numbers from 1 to 14, the ball-1 numbers over 7 is lower, and numbers close to 1 are much higher.
Apart from edge balls, inner balls also display the same Poisson distribution patterns, with pair ball-2/5 have higher λ than ball-1/6, and ball-3/4 have higher λ than ball-2/5.
This distribution pattern for edge and inner ball numbers should be explored further in analysis and analytics on lottery data.
Don't Lay Eggs in All Brackets
Nature exerts pressure to keep the ball bouncing around its defined neutral mean value. Short-term vibrations always exist, and their strength should be measured. This creates a butterfly wing shape in the occurrence frequency domain, which is consistent across similar jackpot lotteries.
While the macro view of time domains over the long run appears evenly distributed, it is shaped by micro fluctuations in the short term, so it's unwise to evenly distribute numbers when filling out a lottery form.
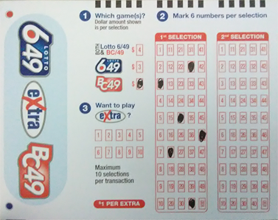
Review the following lottery ticket and see if you can identify where the numbers are incorrectly placed:
Now, refer to the number range graph provided by GameSeer. You can select a square zone and zoom in to examine it closely:
Historical data from the graph shows that in any given draw, the 6 balls rarely fall into all the ranges of 1-9, 10-19, 20-29, 30-39, and 40-49 simultaneously. Instead, a single range often contains 2 balls, sometimes 3, and even 4 balls regularly!
You should never try to spread your 6 eggs evenly across 5 brackets.
Now it's time to dive deeper into the 20 types of lottery data graphs. You'll discover patterns, rules, and facts shaped by nature for the lottery. While this won't guarantee you can guess the 6 winning numbers, using the correct analytics can enhance your chances of hitting a jackpot number.
Welcome to GameSeer's TSRN and lottery graph wonderland!